Installation
Logfile Expert is available on the Mac App Store for macOS 12.0 (Monterey) and later.
- Open the App Store on your Mac
- Search for "Logfile Expert"
- Click Get or the price button to download
- Once installed, Logfile Expert will appear in your Applications folder
First Launch
When you first launch Logfile Expert, the Welcome dialog appears with two options:
- Open File: Browse your Mac to open a local log file
- Open Remote: Connect to a remote server via SFTP

If you close this dialog, you can always access these options from the File menu.
Opening Your First Log File
Local Files
To open a log file from your Mac:
- Select File → Open or press ⌘O
- Navigate to your log file location
- Select the file and click Open
Common log file locations on Linux servers:
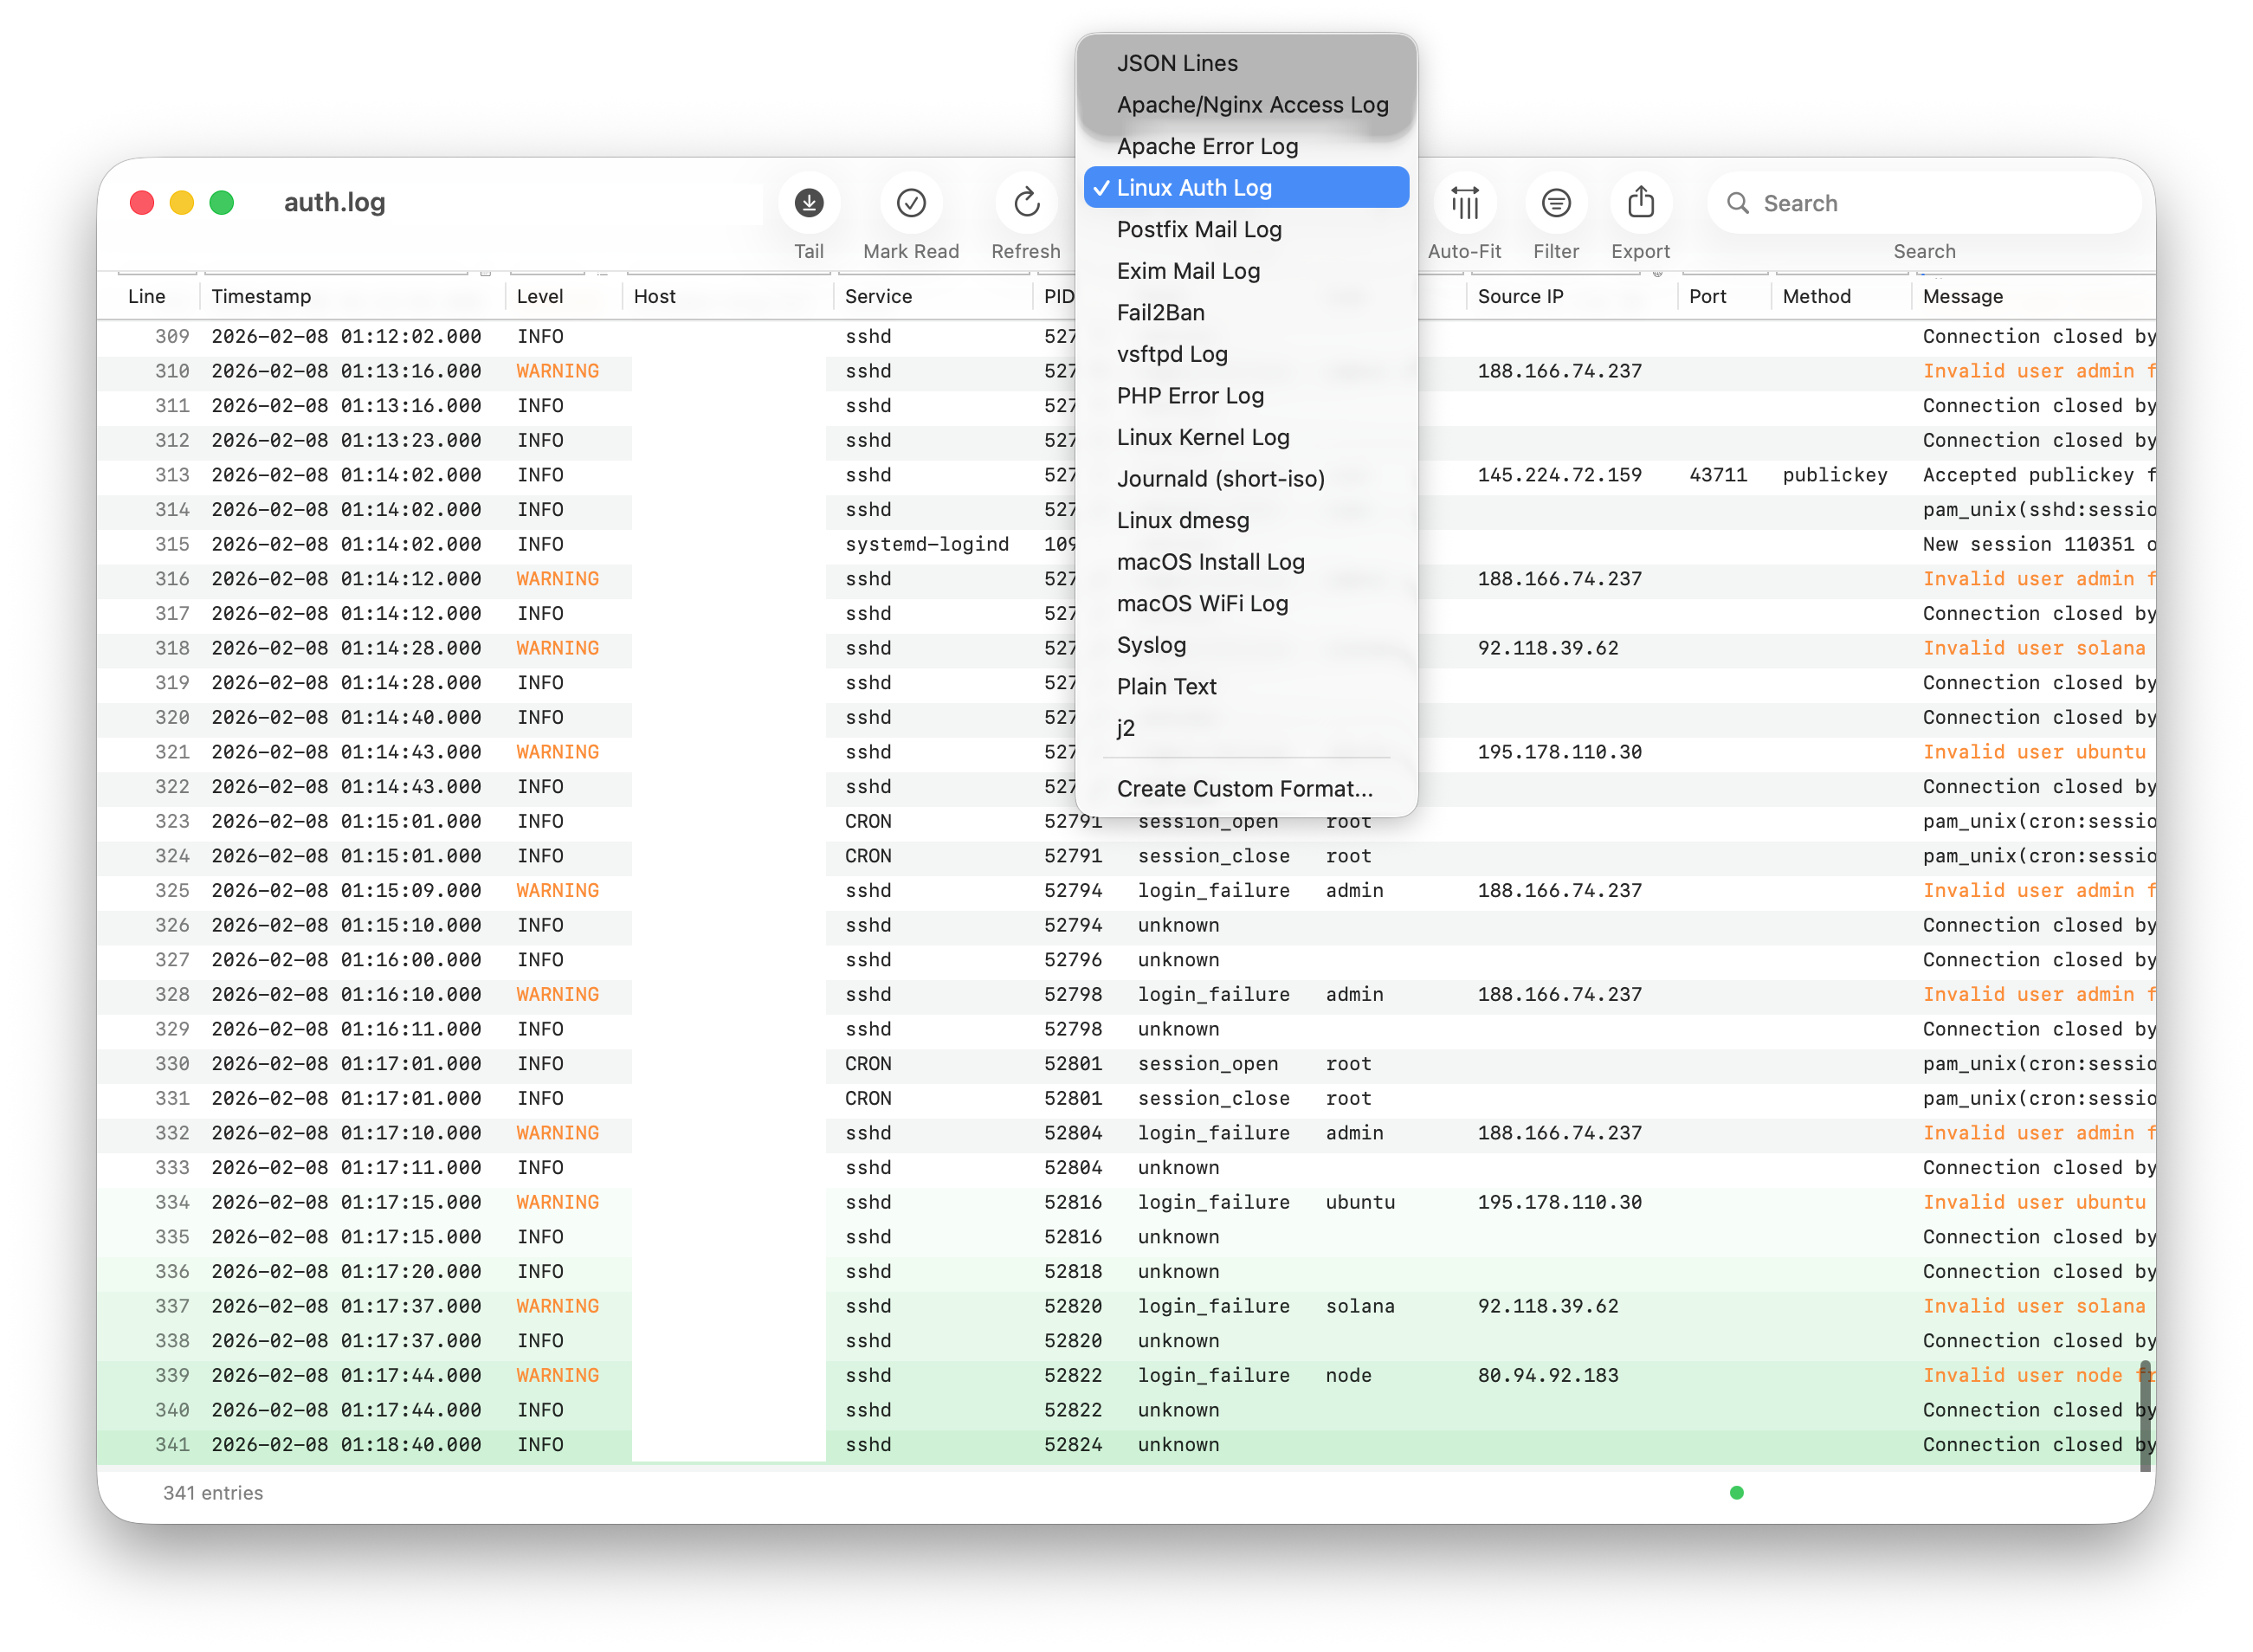
Automatic Format Detection
Logfile Expert automatically detects the format of most common log files. If the wrong format is detected, you can manually select the correct one from the Format dropdown in the toolbar.
Understanding the Interface
Toolbar
The toolbar across the top provides quick access to key functions:
- Tail: Toggle live monitoring (tail mode) to automatically load new entries
- Mark Read: Mark all currently visible entries as read
- Refresh: Reload the log file
- Format: Dropdown to select or change the log format
- Auto-Fit: Automatically adjust column widths to fit content
- Filter: Toggle the column filter row visibility
- Export: Export the current view
- Search: Quick search across all entries
Column Headers and Table
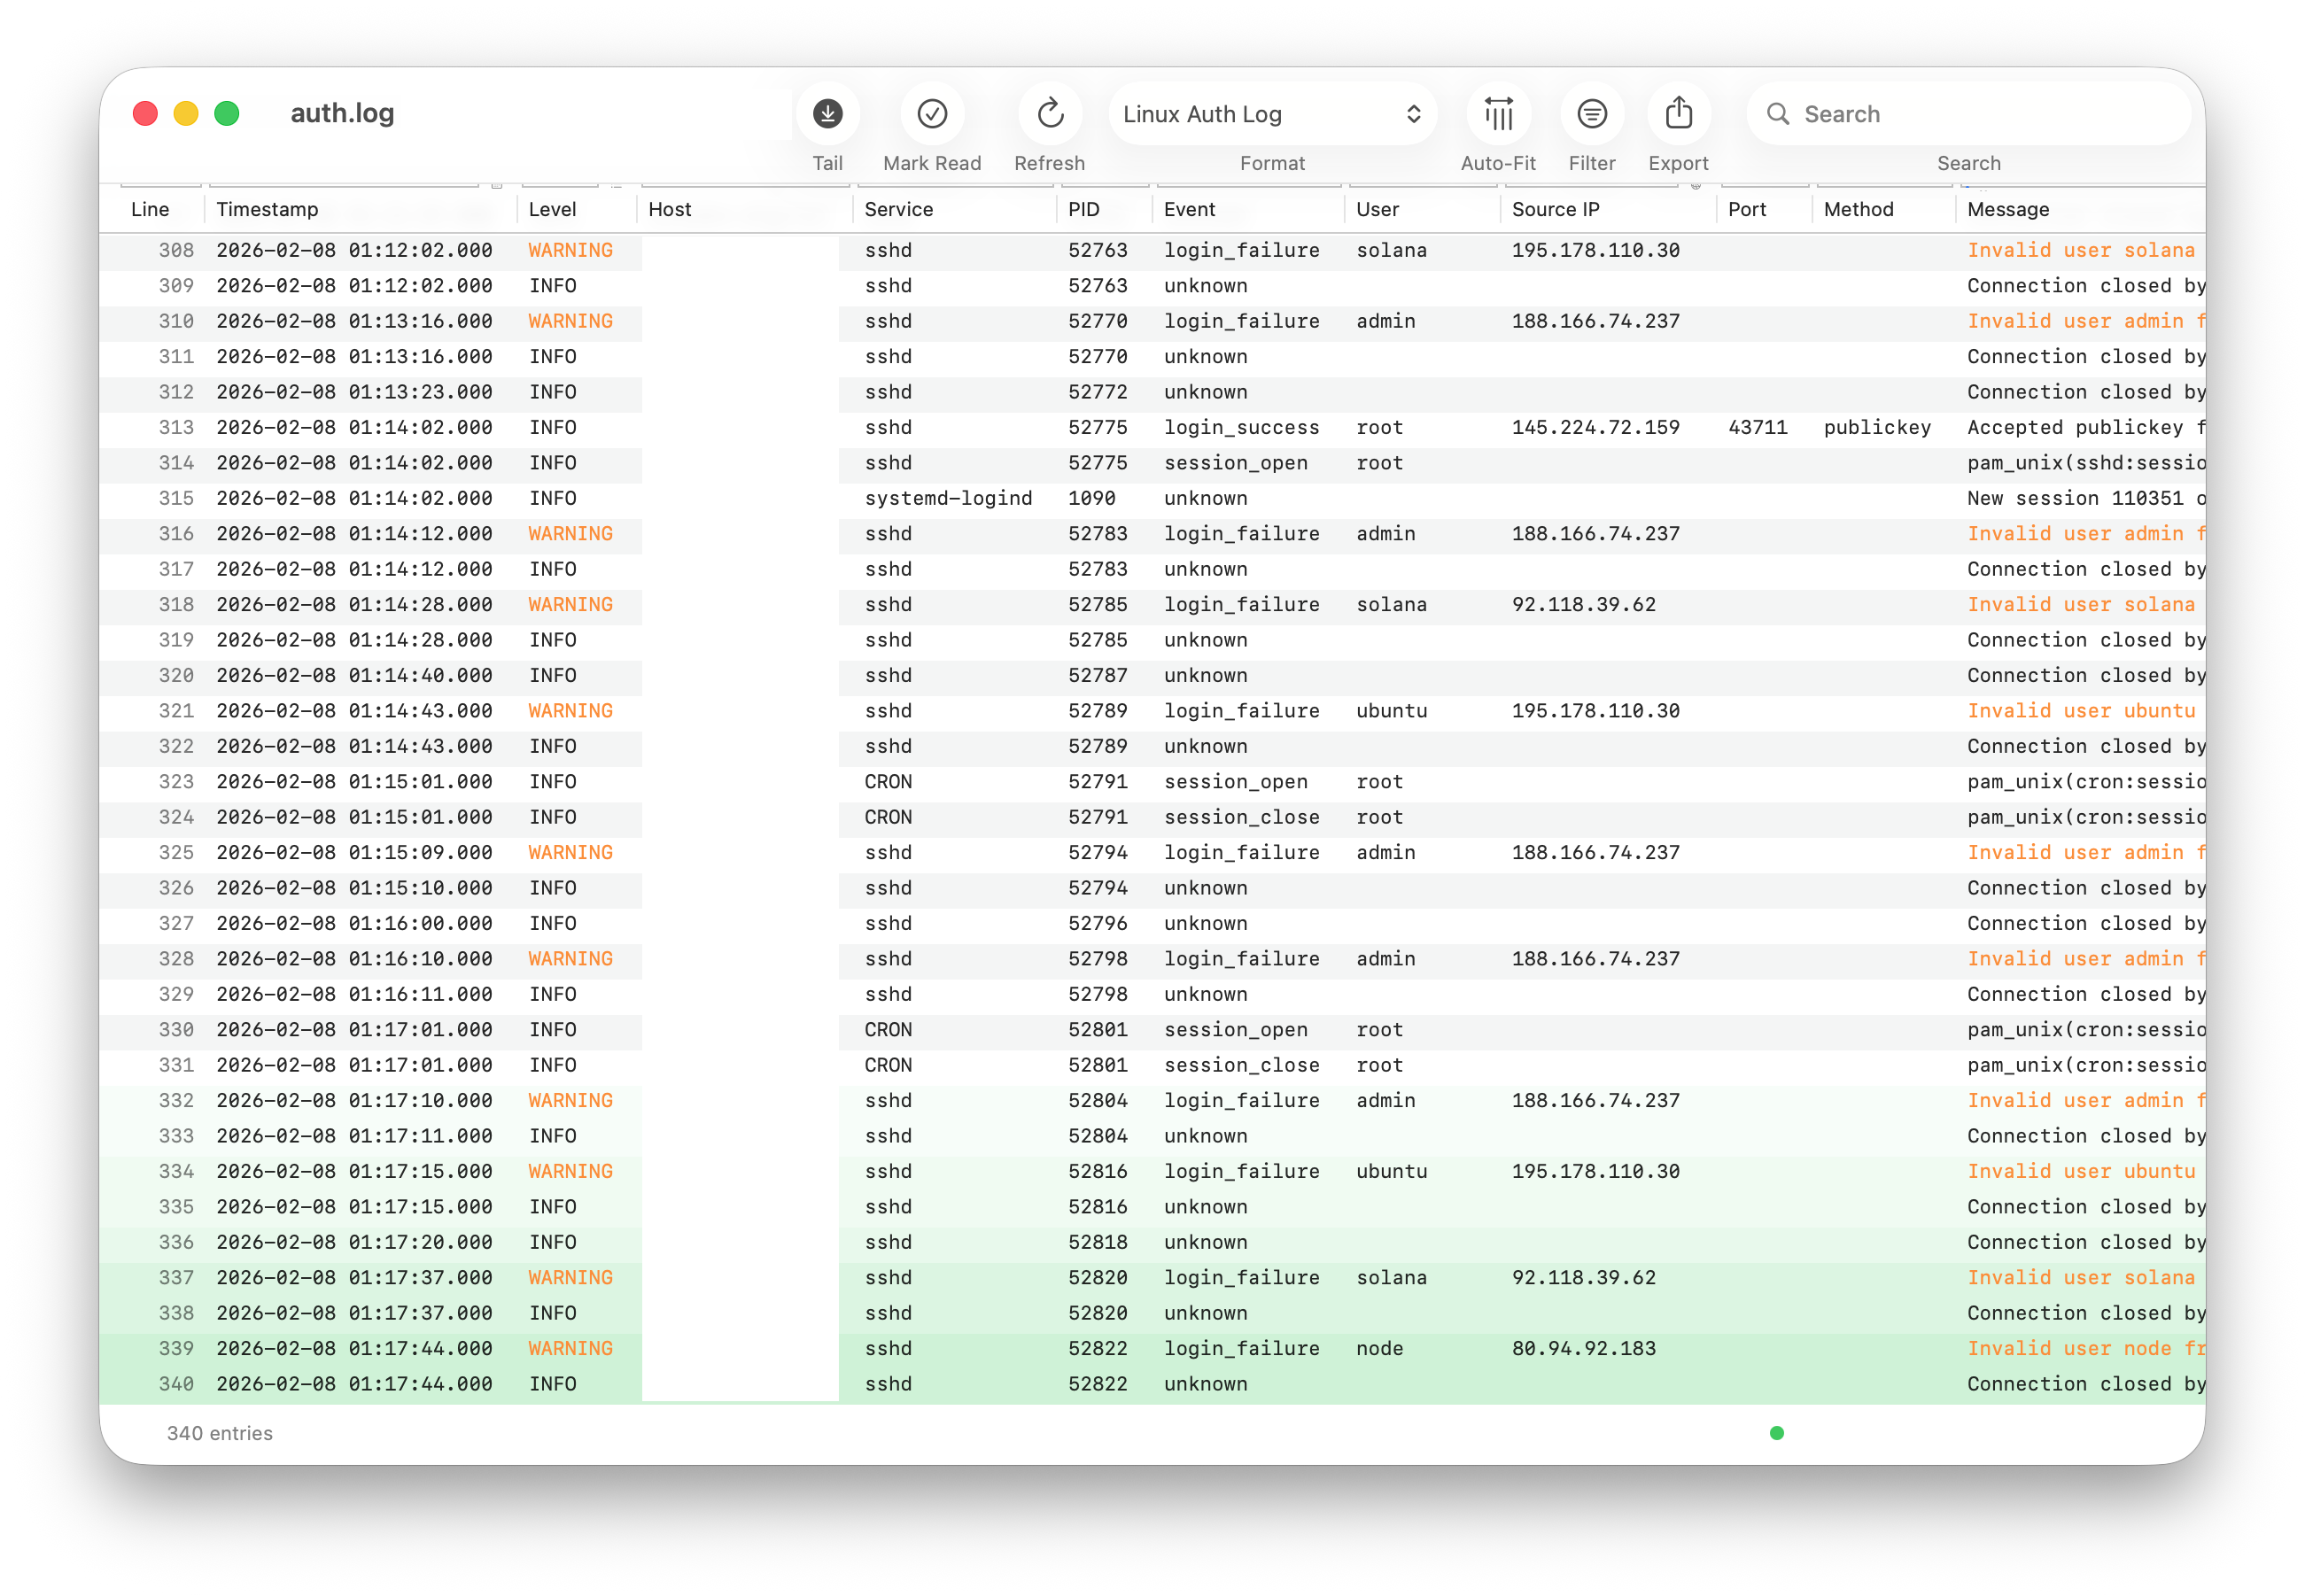
Each log field is displayed in its own column. The specific columns depend on the log format. For example, a Linux auth log shows: Line, Timestamp, Level, Host, Service, PID, Event, User, Source IP, Port, Method, and Message.
Click any column header to sort by that column. Click again to reverse the sort order.
Color Coding
Log entries are color-coded by severity level for quick identification:
- Errors and critical entries are highlighted in red
- Warnings are highlighted in orange
- New entries arriving in tail mode are grouped with a colored background
Status Bar
The bottom status bar shows the total number of entries. When filters are active, it displays the filtered count (e.g., "6 of 345 entries").
Live Monitoring (Tail Mode)
Tail mode automatically checks for new entries written to the log file and appends them to the view.
To toggle tail mode:
- Click the Tail button in the toolbar
In Preferences, you can configure:
- Start in tail mode: Automatically enable tail mode when opening files
- Tail refresh interval: How often to check for new entries (default: 2.0 seconds)
- Group time window: How long new entries are highlighted together (default: 3.0 seconds)
Tail mode works for both local and remote files.